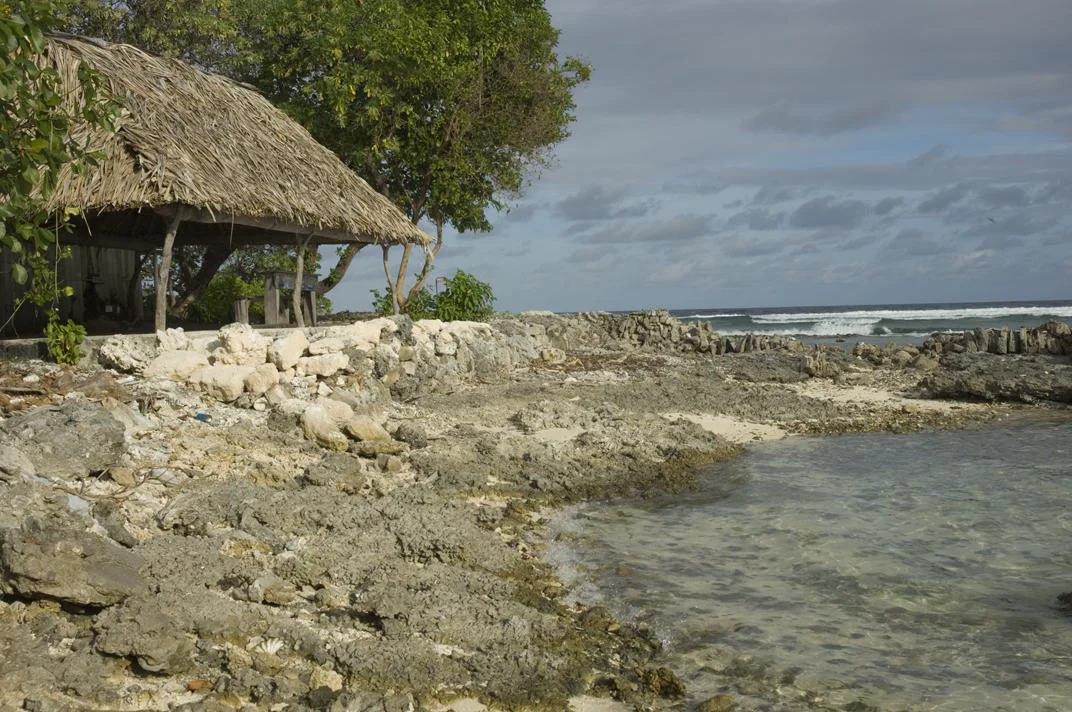
Government of Kiribati · CC BY 3.0 · cropped and colour-adjusted

A climate story from the central Pacific

When the Ocean Arrives

Kiribati's changing climate, a distant warning, homes to hold on to and identity to keep.

The global imbalance

One Atmosphere, Unequal Consequences

In a world driven by economies and development, a global warming issue blooms. This story will not pinpoint or put a blame on certain countries but will explain the current issue of the ones who are suffering. The ocean does not divide consequences according to responsibilities.

Loading the 2024 country distribution…

Each filled circle is one country or territory with a 2024 value. Countries at or above 1 GtCO₂ are enlarged; all other grey circles share one size. Vertical position only prevents overlap. The log-like horizontal scale keeps zero and very small totals visible while preserving the large differences.

Kiribati

Now cross the Oceans

Stretched across the Pacific Ocean lies low-lying atolls. Kiribati’s atolls are geographically 3 meters high above sea level, Banaba excluded. An island nation where innocent smiles of children playing and happy elders share their history, a culture that survived World War II but now fighting a war that seems impossible to win, seeking foreign assistants to delay the future ahead. Facing rising seas, salt entering wells and vast beaches where trees used to sway in the winds. What is at risk is not an abstract future but the graves of loved ones, the home where memories where shared, and the roads that connected everyone.

Hover or focus the Kiribati label for more information.
Annual territorial CO₂ totals · 2024

01 / 02

Kiribati versus the world

Measure: annual territorial CO₂ totals, not all greenhouse gases or emissions per person. Source: Global Carbon Project dataset used in the evidence section; values rounded for display.

01 · Global context

Compared with the world, our CO₂ emissions are almost invisible.

02 · Pacific context

Within the Pacific, Kiribati’s CO₂ contribution is barely visible.

Since 1971, annual carbon dioxide emissions in this dataset have . Across the Pacific, Kiribati leaves . But carbon does not remain where it was released. Its consequences travel, arriving on these low-lying atolls as water at the door and salt in the well.

Here, climate change is not only a projection on a chart. It enters land, memory and belonging. Shoreline change, flooding and saltwater intrusion place homes and essential services at risk. The possibility of moving raises a harder question: what happens when safety may require distance from the land that carries family history, culture and identity? Kiribati’s own climate planning recognizes that protecting culture, heritage and identity is part of resilience—not an afterthought.

Beneath the coral ground lies a fragile reserve: thin freshwater lenses replenished by rain. During drought, recharge falls. When seawater overtops the land or enters wells, salinity can rise and water may become unsuitable for drinking or growing food. In Kiribati, . Either extreme can reach the most ordinary acts of life—filling a cup, washing a child, tending a garden.

Pacific rainfall anomaly · 1979–2025

Rain does not fall evenly across the ocean.

Travel through the years across 22 Pacific countries, to reveal a region connected by the ocean and never by one uniform climate pattern.

Kiribati
Drier than referenceNear referenceWetter than reference

How to read: Choose a year, then point to or select a country. Coral means rainfall was below the dataset reference; deeper coral means a larger dry departure. Cyan means above the reference; deeper cyan means a larger wet departure. This is not total rainfall, and the dots are enlarged so small islands remain selectable. Source: Pacific Community (SPC), Pacific Data Hub — Climate Change Indicators: Precipitation anomalies, accessed 2026.

Household vulnerability · HIES 2023–24

The next climate shock will not arrive in an empty household.

The HIES does not measure climate impacts. It shows the conditions a future disruption would meet: dependence on rainwater, uneven sanitation, scarce savings and pressure from everyday bills.

Household conditions · HIES 2023–24Rainwater as main drinking source50.2%

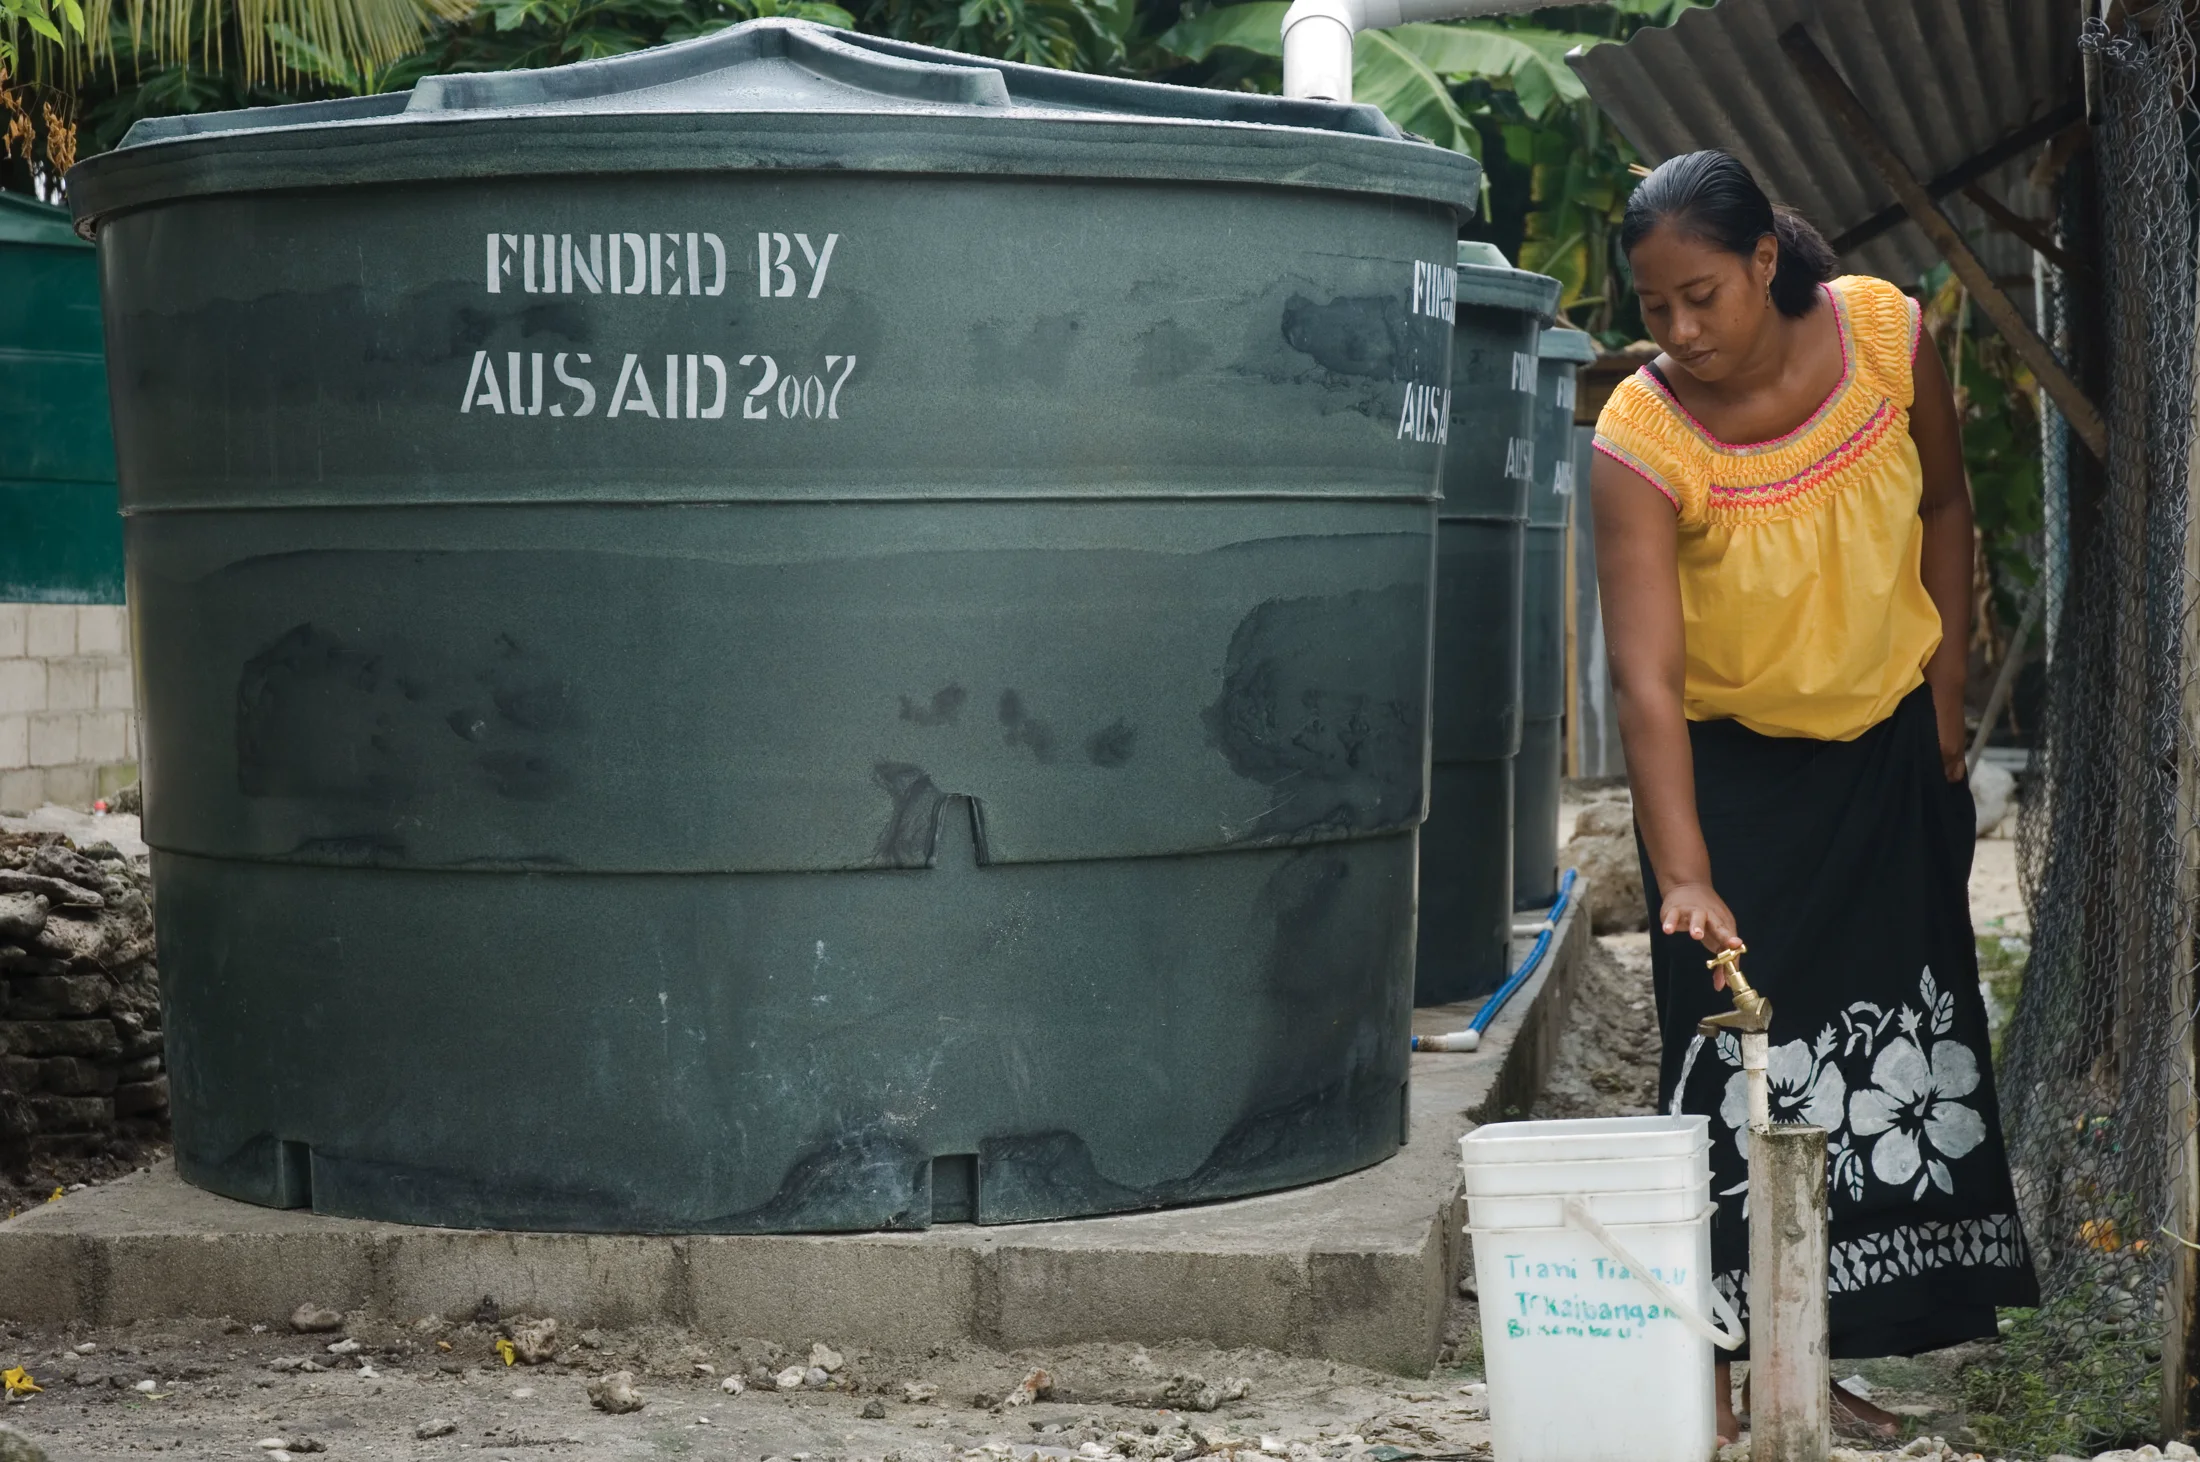
For around half of households, drinking water depends first on the rain tank.

A long dry spell can leave a family watching the water level fall while the cost of finding another safe supply rises.

Maria Kaburoro collects freshwater from a rainwater tank in Kiribati
Behind every percentage is a family preparing for the next uncertain day.
Lorrie Graham / AusAID · CC BY 2.0

These are existing household pressures, not conditions proven to have been caused by climate change. They help show why the same shock can be much harder for some families to withstand.

From capacity to support

Adaptation is what stands between a warning and a loss.

A secure water tank, a safer road, a protected shoreline and the power to decide locally can turn foresight into protection. Without them, communities are asked to survive a crisis they did little to create.

IIED found that only 0.17% of reported international climate finance between 2016 and 2023 explicitly mentioned “locally led” or “community led” action. Weak reporting also makes it difficult to trace where much funding ultimately went.

“Many more climate funds need to reach the local level.”

Andrew Norton, former IIED director

This finding is global, not Kiribati-specific. But it sharpens the need for Kiribati’s finance to be transparent, accessible and grant-based—and for communities to help decide how freshwater, housing, coastal protection and the right to remain are supported.

Source: International Institute for Environment and Development, “Climate finance not reaching the local level”. IIED’s findings concern international climate-finance reporting generally; they are not Kiribati-specific.

Kiribati-specific evidence · 2013–2024

A promise recorded is not yet support received.

The selected OECD extract records $225.7 million in commitments to projects with an adaptation objective in Kiribati between 2013 and 2024, in constant 2024 US dollars. It records commitments—not confirmed disbursements, local expenditure or money received by individual communities.

Annual commitments · constant 2024 USD millions

Adaptation-related project commitments for Kiribati

$225.7mTotal · annual average $18.8m
$0m$25m$50m$11.92013$2.22014$2.02015$35.52016$9.52017$7.92018$44.42019$15.82020$32.72021$21.22022$23.82023$18.72024
Bars show funding commitments recorded in each year—not board approvals, confirmed payments or expenditure in that year. Climate-related project values may include whole projects whose adaptation objective is only one component.

The annual average is $18.8 million, and 2019 commitments were 22.4 times the 2015 low. A multi-year project can be recorded in one commitment year, so the pattern does not prove delays, missing funds or an equivalent variation in annual spending.

Public Kiribati project documents identify water-security work for Makin, Aranuka and Tabiteuea South. They make the intended activities and locations visible, but planned works and expected beneficiaries should not be described as completed delivery without implementation evidence.

Sources: OECD explanation of climate-related development finance; Adaptation Fund Kiribati outer-island water-security project. The OECD extract measures project commitments; the project listing identifies planned work, not a complete delivery audit.

Evidence to action

The imbalance can be measured. Justice must be felt on the ground.

01 · What the evidence shows

Kiribati contributes an almost vanishing share of global CO₂ emissions, while low land, fragile freshwater and household pressures deepen the risk of harm.

02 · What the public record cannot yet show

Available sources do not provide a complete community-by-community account of how much funding arrived or consistently document how local priorities shaped spending.

03 · What accountability must mean

Support people can see, decisions communities can shape, and reporting they can verify—before another tide turns a promise into a missed chance.

Kiribati’s future should not be measured only by how much land the ocean may take, but by how much choice, dignity and belonging its people are able to keep.
A coastal home standing beside the ocean in Tarawa, Kiribati
Coastal home in Tarawa. Photo: Lorrie Graham for AusAID, CC BY 2.0, via Wikimedia Commons. Cropped and colour-adjusted.

Data and methodology

Explore the complete evidence

Follow the numbers behind the story. Each view keeps the source, definition and limits close to the claim it supports.

Tools and authorship

Tools used: React, Next.js/Vinext, TypeScript and JavaScript for the website structure and interaction; D3.js for the charts, maps, scales and transitions; TopoJSON and World Atlas for geographic shapes; HTML, CSS and SVG for layout, styling, animation and accessible presentation; and CSV/JSON files for structured data. Git was used for version control.

Authorship statement: The story concept, narrative, ideas, interpretation and creative direction are my own original, organic work. The coding and technical implementation were produced by AI using OpenAI Codex/ChatGPT, following my instructions, revisions and editorial decisions.

Reusable media credits

All photographs used in this story are licensed for reuse and adaptation under Creative Commons Attribution licences. Each record below links to its exact terms and original source.